“Why buy bonds when I can make money on anything?!” – 3rd quarter, 2025
Answer: Because extrapolating four months of returns is not an investment strategy
Why do investors buy bonds? Why even bother with credit? What’s with the popularity of hedge funds or the obsession over alternatives? Why would anyone think they need to invest in something called “private”?
Sure, yes, investors like income. They also like steady-eddy investment returns that come in a perfectly straight line. Investors don’t like drawdowns, especially the drawn-out decline that ends in gut-wrenching capitulation. Violent price swings are discomforting, and we like feeling comfortable. We buy this stuff because it smooths out the ride and makes us feel good. It’s good to feel good.
Do investors really chase this stuff because it makes them “feel good”?
In our view, the reason investors were initially drawn to the idea of bonds, or credit, and now to hedge funds no one can understand and alternatives and all this private nonsense, isn’t just to avoid some short-term volatility. It’s because we all know – deep down, as much as we want to forget – that the stock market has a tendency to deliver a decade or more of misery just when we least expect it.
Somewhere in the back of our minds, we all know this is an unfortunate reality:
S&P Historical Composite Index returns
1877 to 2024
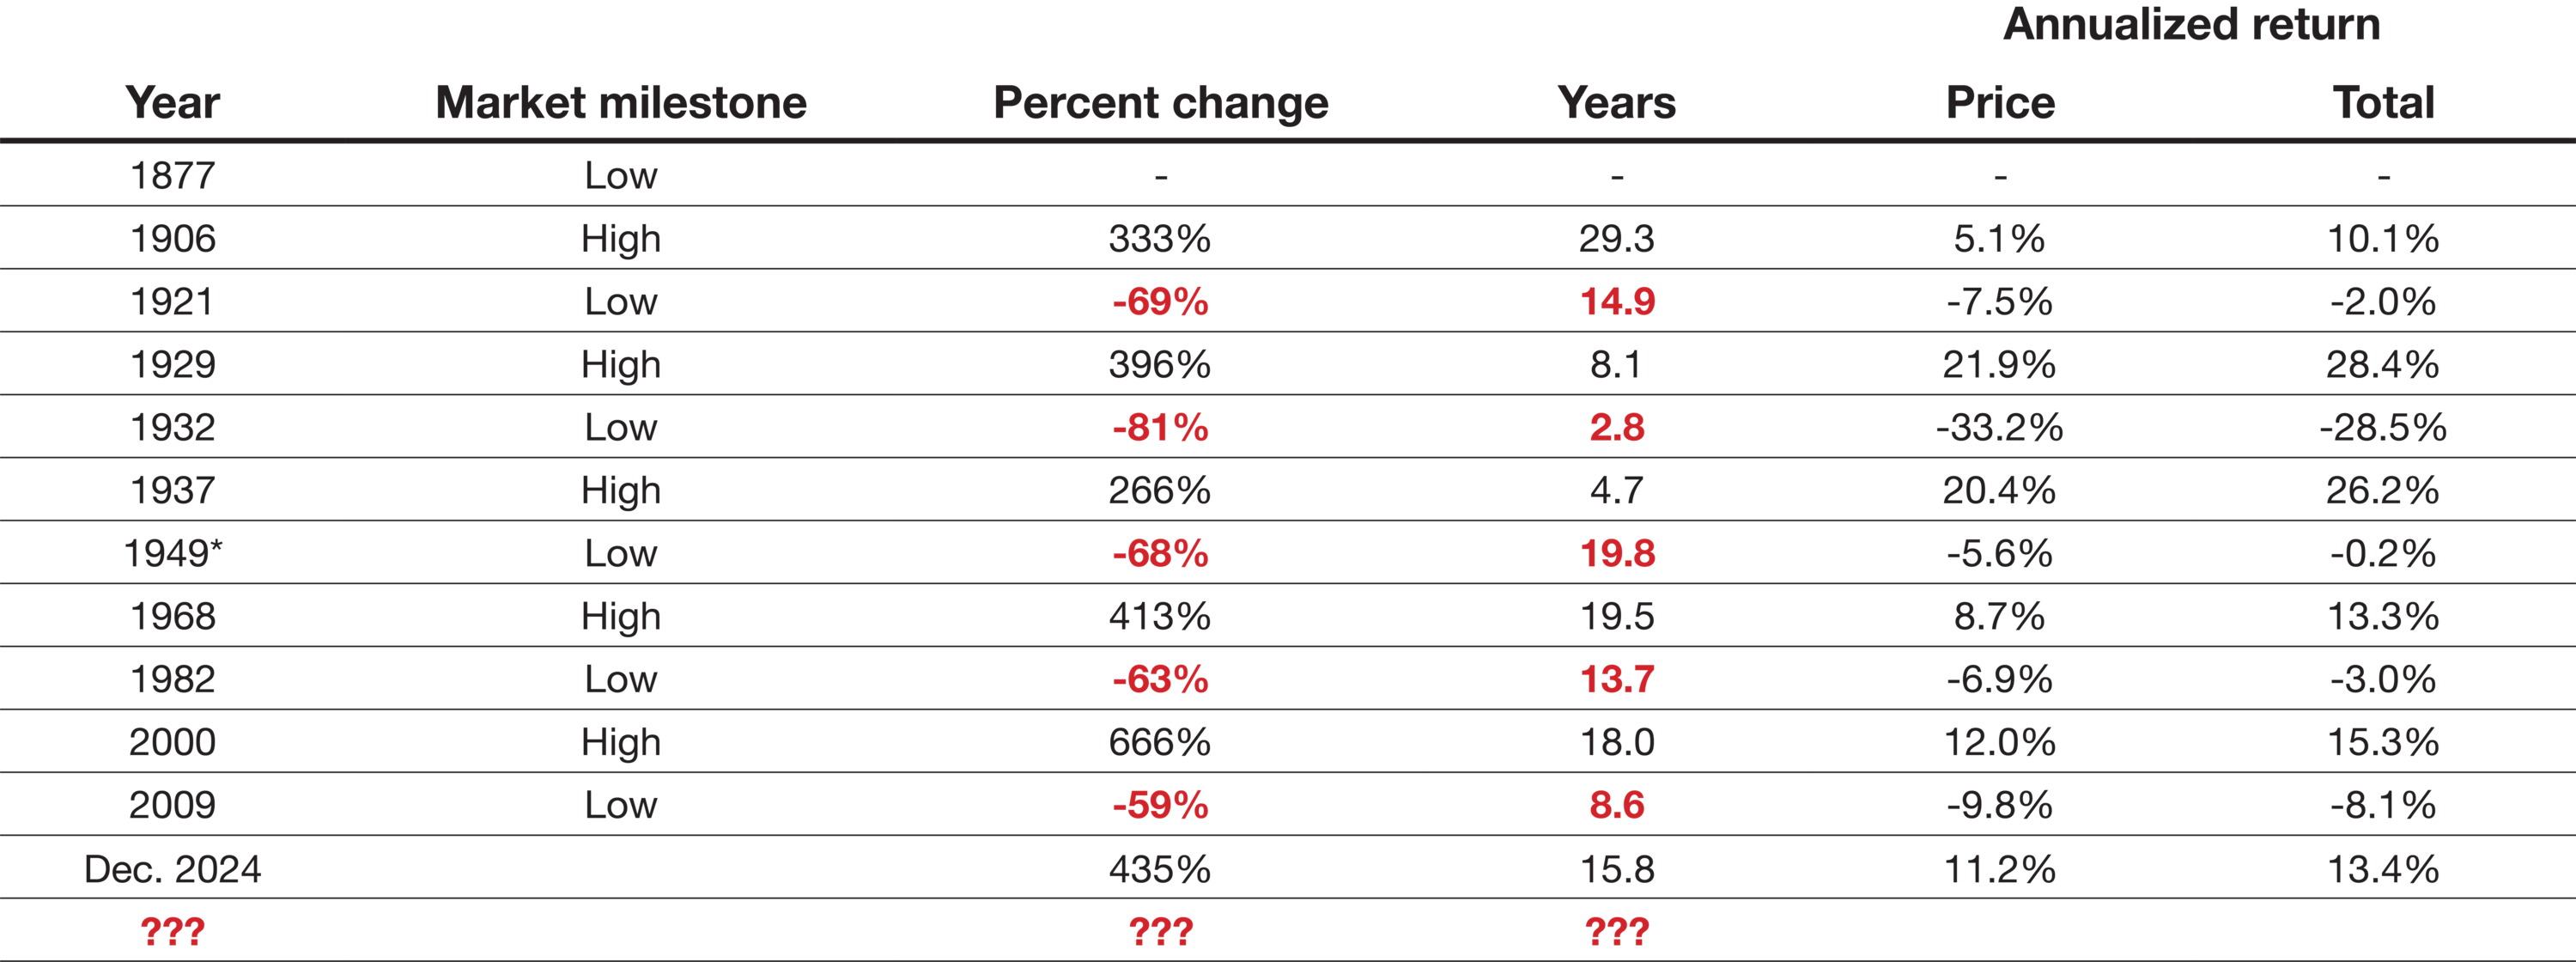
* 1949 data is relative to 1929. Source, 1877 to 2009: Jennifer Nash, “Secular Market Trends: Bull and Bear Markets”, AdvisorPerspectives.com. January 6, 2025. Source, Dec. 2024: Bloomberg LP. As at December 31, 2024. Returns are inflation-adjusted monthly averages of daily closes. The S&P 500 Index was used for the S&P Historical Composite Index starting in March 1957 and is a broad-based market-capitalization-weighted index of 500 of the largest and most widely held U.S. stocks. The index is not investible. Prior to that date, the data used a collection of companies selected by S&P.
Yuck.
Bad stock markets exist; they’re a reality no one wants to endure, but all need to acknowledge, and something those who play the game long enough will inevitably have the displeasure of having to experience.
The misery is always lurking.
Partly to avoid having to confront this reality, and partly to pursue the holy grail investment solution that only ever goes up, investors are drawn to the alternatives. Well, alternatives and “Alternatives.” An alternative to us is anything that isn’t an equity. “Alternatives” are a special category of alternative – stuff that would require an alternate universe to deliver on the promised returns.
Bonds – and carefully studied corporate bonds in particular – are an alternative to stocks that become more important to a portfolio the frothier things get in equities. We’ll describe why a little later.
“Alternatives” have been getting a lot of attention more recently. While selling a narrative that sounds similar to the case for bonds, the underlying risk exposures are anything but. Uniformly complex, deliberately opaque and overwhelmingly layered with leverage either explicit or implied, these investment products seem designed to introduce risks to a portfolio so obscure that the fee is the price of admission for front-row seats to the circus. Where will the clown pop out of next?
The rise of the “Alternative”
Hedge funds were the first iteration, beginning with some version of a long-short blend of stocks and bonds. These funds come and go but most ultimately disappear as managers inevitably hit a period where “shorts” rise as “longs” fall, turning what’s meant as a “hedge” into losses in all directions.
There are many long-short funds with strong short-term track records – not many with long track records. In aggregate, hedge fund performance has been notoriously disappointing, delivering just over 4% annualized in the 10-years through December 2024.i With fading allure of hedge funds, “Alts” needed new branding.
Over the past few years, the “Alternatives” universe has evolved into something made up almost entirely of “privates,” which seems to mean taking an asset that used to trade, now making it not trade, and pretending it’s something else. These private investments have gone above and beyond in billing themselves as your perfect investment, somehow investing in assets fully available to public markets, yet doing so with higher returns, lower risk, and no – no – volatility.
Most private investment products have performance trajectory that looks something like this:
The “perfect” investment
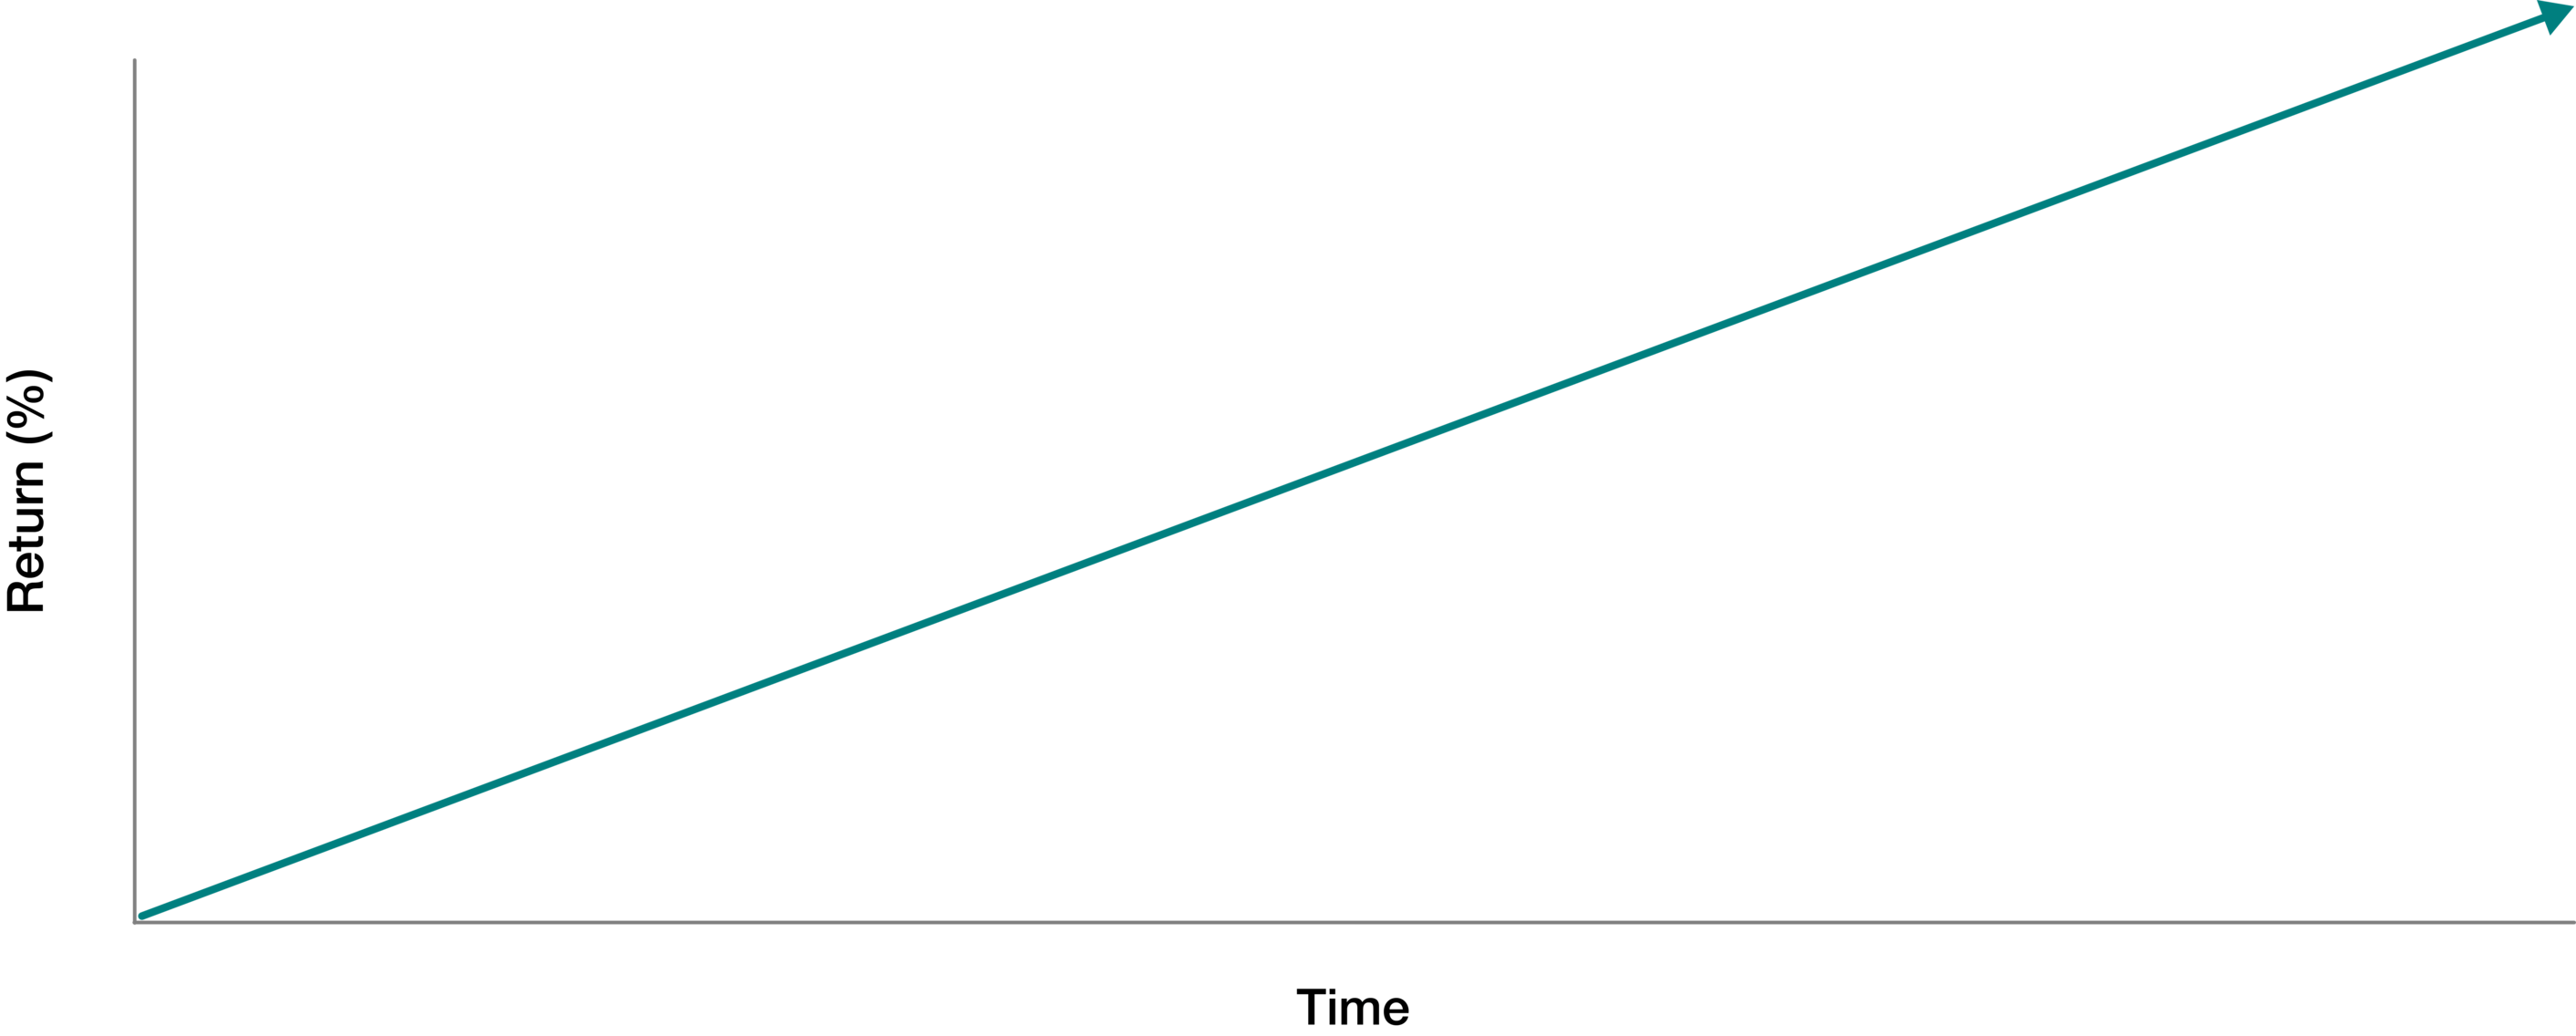
Investors need to understand – the managers of private investment funds have broad discretion in how the underlying assets are valued. Without a market price, a lot of guesswork is involved in determining “fair value,” and the final price is massively influenced by the assumptions and methods applied by the manager. In buying into these funds, the end investor is placing an awful lot of trust in a highly subjective, error-prone and heavily biased valuation exercise. The price might be way off.
If an investment portfolio delivers returns that look like they were drawn with a measuring stick, chances are that the stated value of the investments are deviating from reality. And while we do all like to feel good – and the industry tells us these straight-line returns should make us feel really good – one would suspect it might feel really bad when investors become aware of this deviation.
Sometimes these straight-line investment returns end up adjusting to what they’re actually worth, which looks more like this real-life example:
Canadian offering memorandum senior debt fund, Series F – Growth of $10,000
May 2018 to Aug. 2025
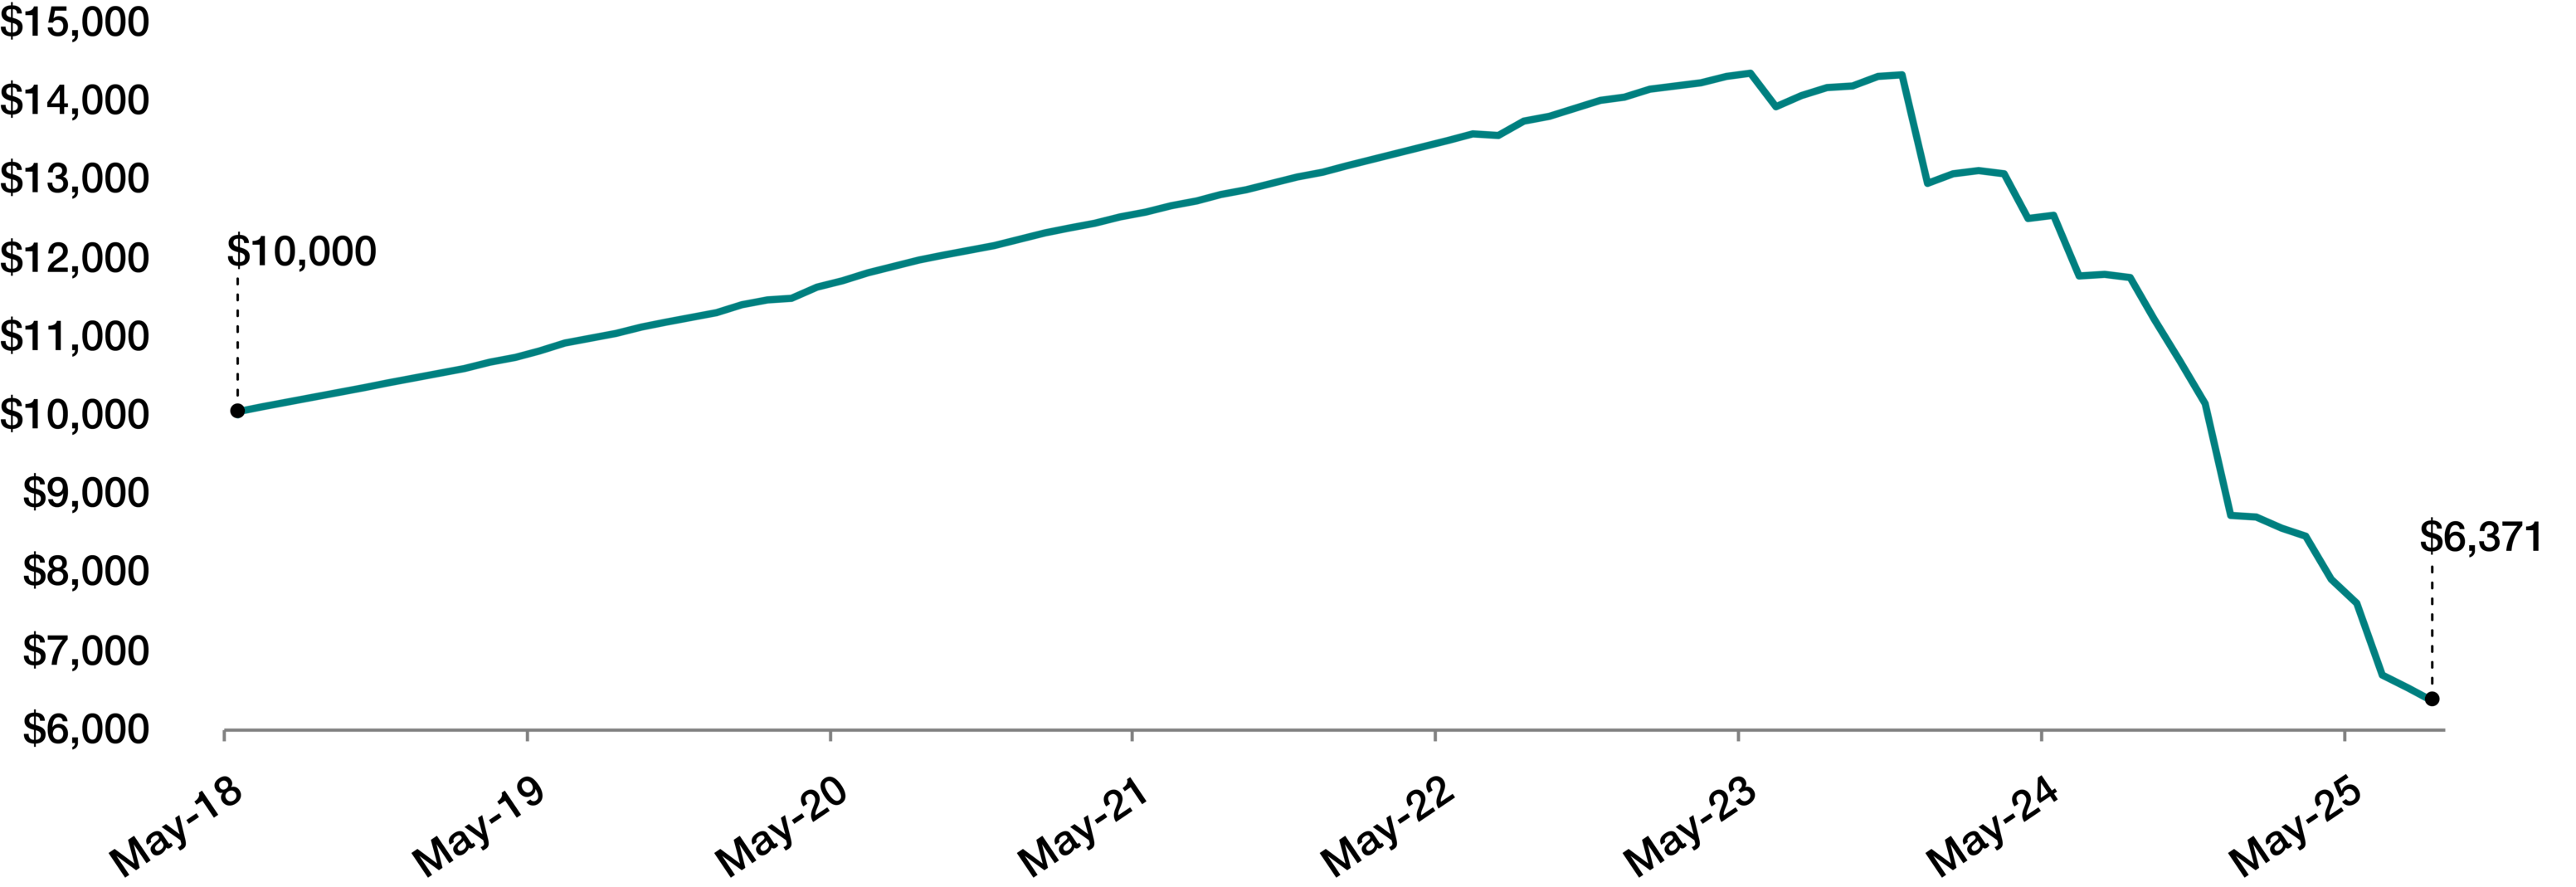
Source: Canadian fund company website. Total annualized returns, net of fees (excluding advisory fees), in C$. The above example is an actual Canadian senior debt fund that was available via offering memorandum and gated in 2024.
This collision with reality often occurs when investors start asking for their money back. Every fund on the planet will inevitably enter a period where flows turn negative. When your EdgePoint Portfolios have a redemption, we sell stocks and bonds to fund the redemption. The price investors are redeeming at is the price we’ve sold the securities. That’s the model. There’s no reason to ever need a “gate.” But private assets don’t trade. When outflows hit a private fund, simply by design, it will have to limit redemptions.
Any investor buying a “private” investment fund needs to assume it will be gated. Other than taking on debt (yikes?), the fund has no mechanism to deal with the redemption. Only in the months and years after being gated will investors find out what the investments are really worth.
At the moment, there’s some “contagion” moving through the Canadian private fund industry. So far it’s concentrated in real estate but likely making its way for other assets. What began several years ago with real estate lending pools has migrated more recently to private mortgage and private real estate funds, with some $16 billion in Canadian assets publicly disclosed as being throttled.ii
Most of these funds had very strong, straight-line investment results leading to the gate. Were the results an illusion? Whether losses will follow remains to be seen. But if the underlying assets could be sold at the price they’re stated to be worth, the funds wouldn’t be gated.
Inevitably, all private assets held in open-end investment funds – including our favourite, private debt – will encounter the same fate. Whether it happens months or years in the future, nobody knows. It depends on how long investors keep the faith.
In the meantime, if you do encounter an energetic salesperson trying to hawk some private debt fund, be sure to check out the fund company’s publicly traded “Business Development Company,” or “BDC.” BDCs run by the same manager often hold the same investments, or, at the very least, are managed by the same investment team applying the same approach. Recently, most have – well – collapsed, and today trade some 5% to 25% below stated “fair value.” At the very least, ask for a discount.
Business development companies – price-to-book-value
Sep. 30, 2024 to Sep. 30, 2025
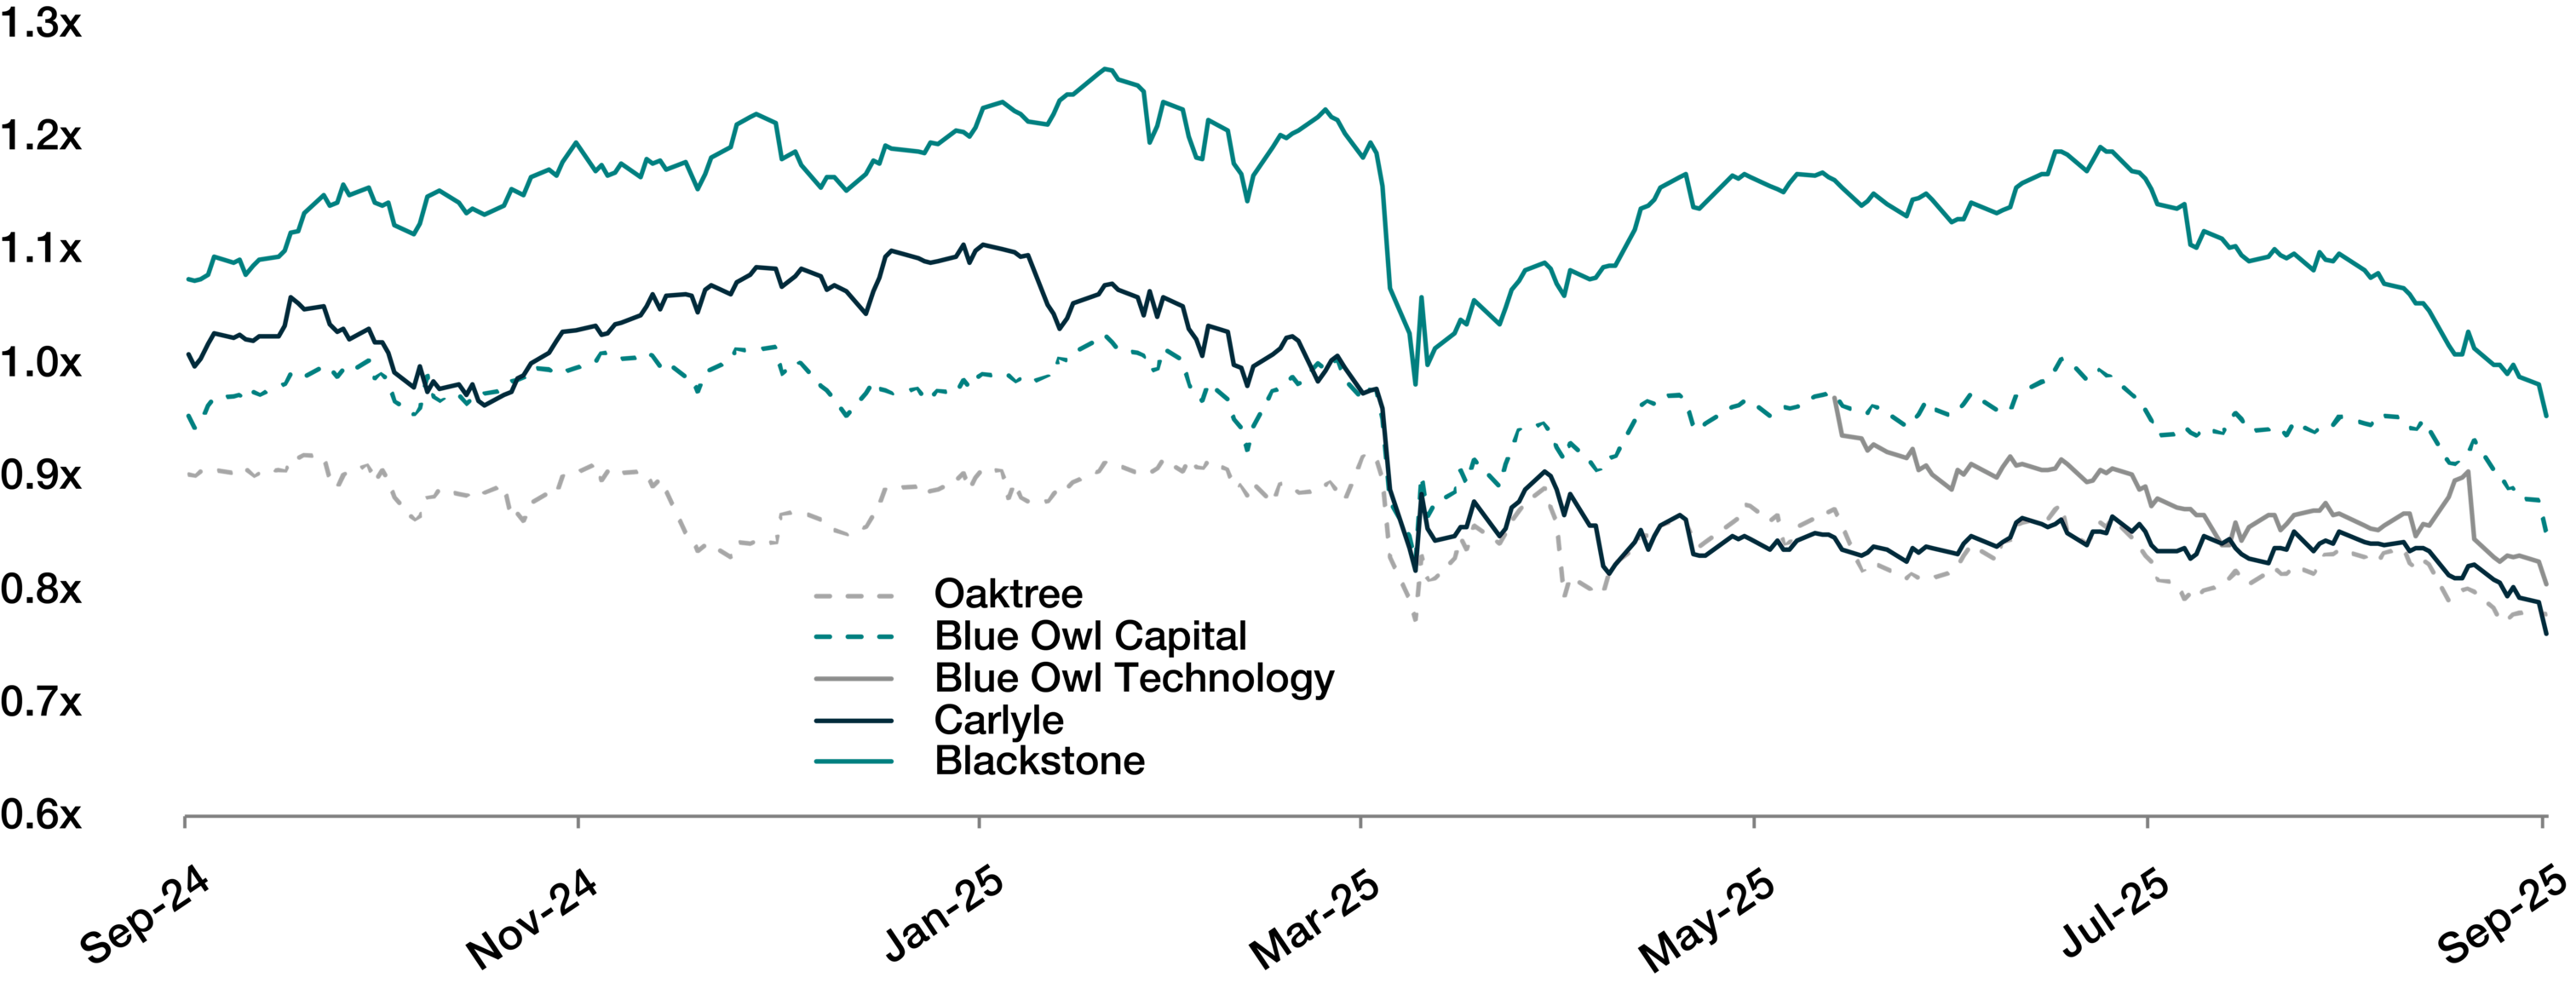
Source: Bloomberg LP. As at September 30, 2025. In US$. Example BDCs are Oaktree Specialty Lending Corp., Blue Owl Capital Corp., Blue Owl Technology Finance Corp, Carlyle Secured Lending Inc. and Blackstone Secured Lending Fund. Price-to-book value is a security’s share price relative to its assets minus liabilities. Blue Owl Technology Finance Corp. launched on June 12, 2025.
Beyond the half-dozen real estate gates, this past month has seen the bankruptcy of the third largest used-car dealer in California and Texas, the wipeout of close to US$6 billion in debt owed by an auto parts supplier, a Canadian mortgage fraud and an 80% decline in the bonds of Latin America’s largest petrochemical producer.iii They say good things come in threes. Better things come in fours. Maybe credit markets are finally in for some excitement.
Corporate bonds as the “alternative”
So, “private” alternatives only alternate reality for make-believe, and hedge funds add more to risk than they add to return. Does this mean we should accept the fate of the lost decade (or more) that will inevitably come to stocks – particularly the stock portfolio that looks anything like an index?
There’s an alternative (small “a” on that one). In our view, a concentrated, high-conviction portfolio of corporate bonds – particularly high-yield bonds – managed with an approach that emphasizes the businesses being invested in above anything else is the best way to recognize that things will not always be rosy simply piling willy-nilly into stocks.iv Who needs the bells and whistles of all the weird “Alts” if a simple portfolio of corporate bonds, or credit, can accomplish the same goal?
You don’t buy credit for bull markets. Credit – public credit, with real price discovery – is built for bad markets. It’s the ideal investment to defend against the risk of a lost decade.
In recent months, it’s been easy to dismiss the return potential in credit. After several years of equity-like returns, our flagship fixed-income credit portfolio only available through prospectus exemption (not the actual name of the Portfolio, but you can read all about it here), has seen its yield-to-maturity - a reasonable guide to return expectations - decline to the high single-digits.v And who wants that when you can make money on anything?! Nasdaq and bitcoin. Spanish and Brazilian stocks. Canadian banks and all this nonsense. None of it makes any sense. But it gets people’s attention. And it gets people thinking the good times will continue.
But it’s times like these that investors need credit most. With the recent appreciation in all these different assets, what does it mean for future returns? Would people keep buying if they had a “yield-to-maturity”?
We began this commentary by noting the extended periods of misery that can occur with stocks. We didn’t predict when the next one would happen. The figure below might serve as a guide, charting 10-year returns on the S&P 500 against starting valuation (as measured by the price-to-earnings ratio). From today’s 23.4x, all previous periods delivered a forward 10-year return between -5% and 2%. Yep – that’s 100% of the outcomes from today’s starting valuation.
S&P 500 Index – 10-year forward returns vs. 1-year forward P/E
Sep. 1990 to Sep. 2025
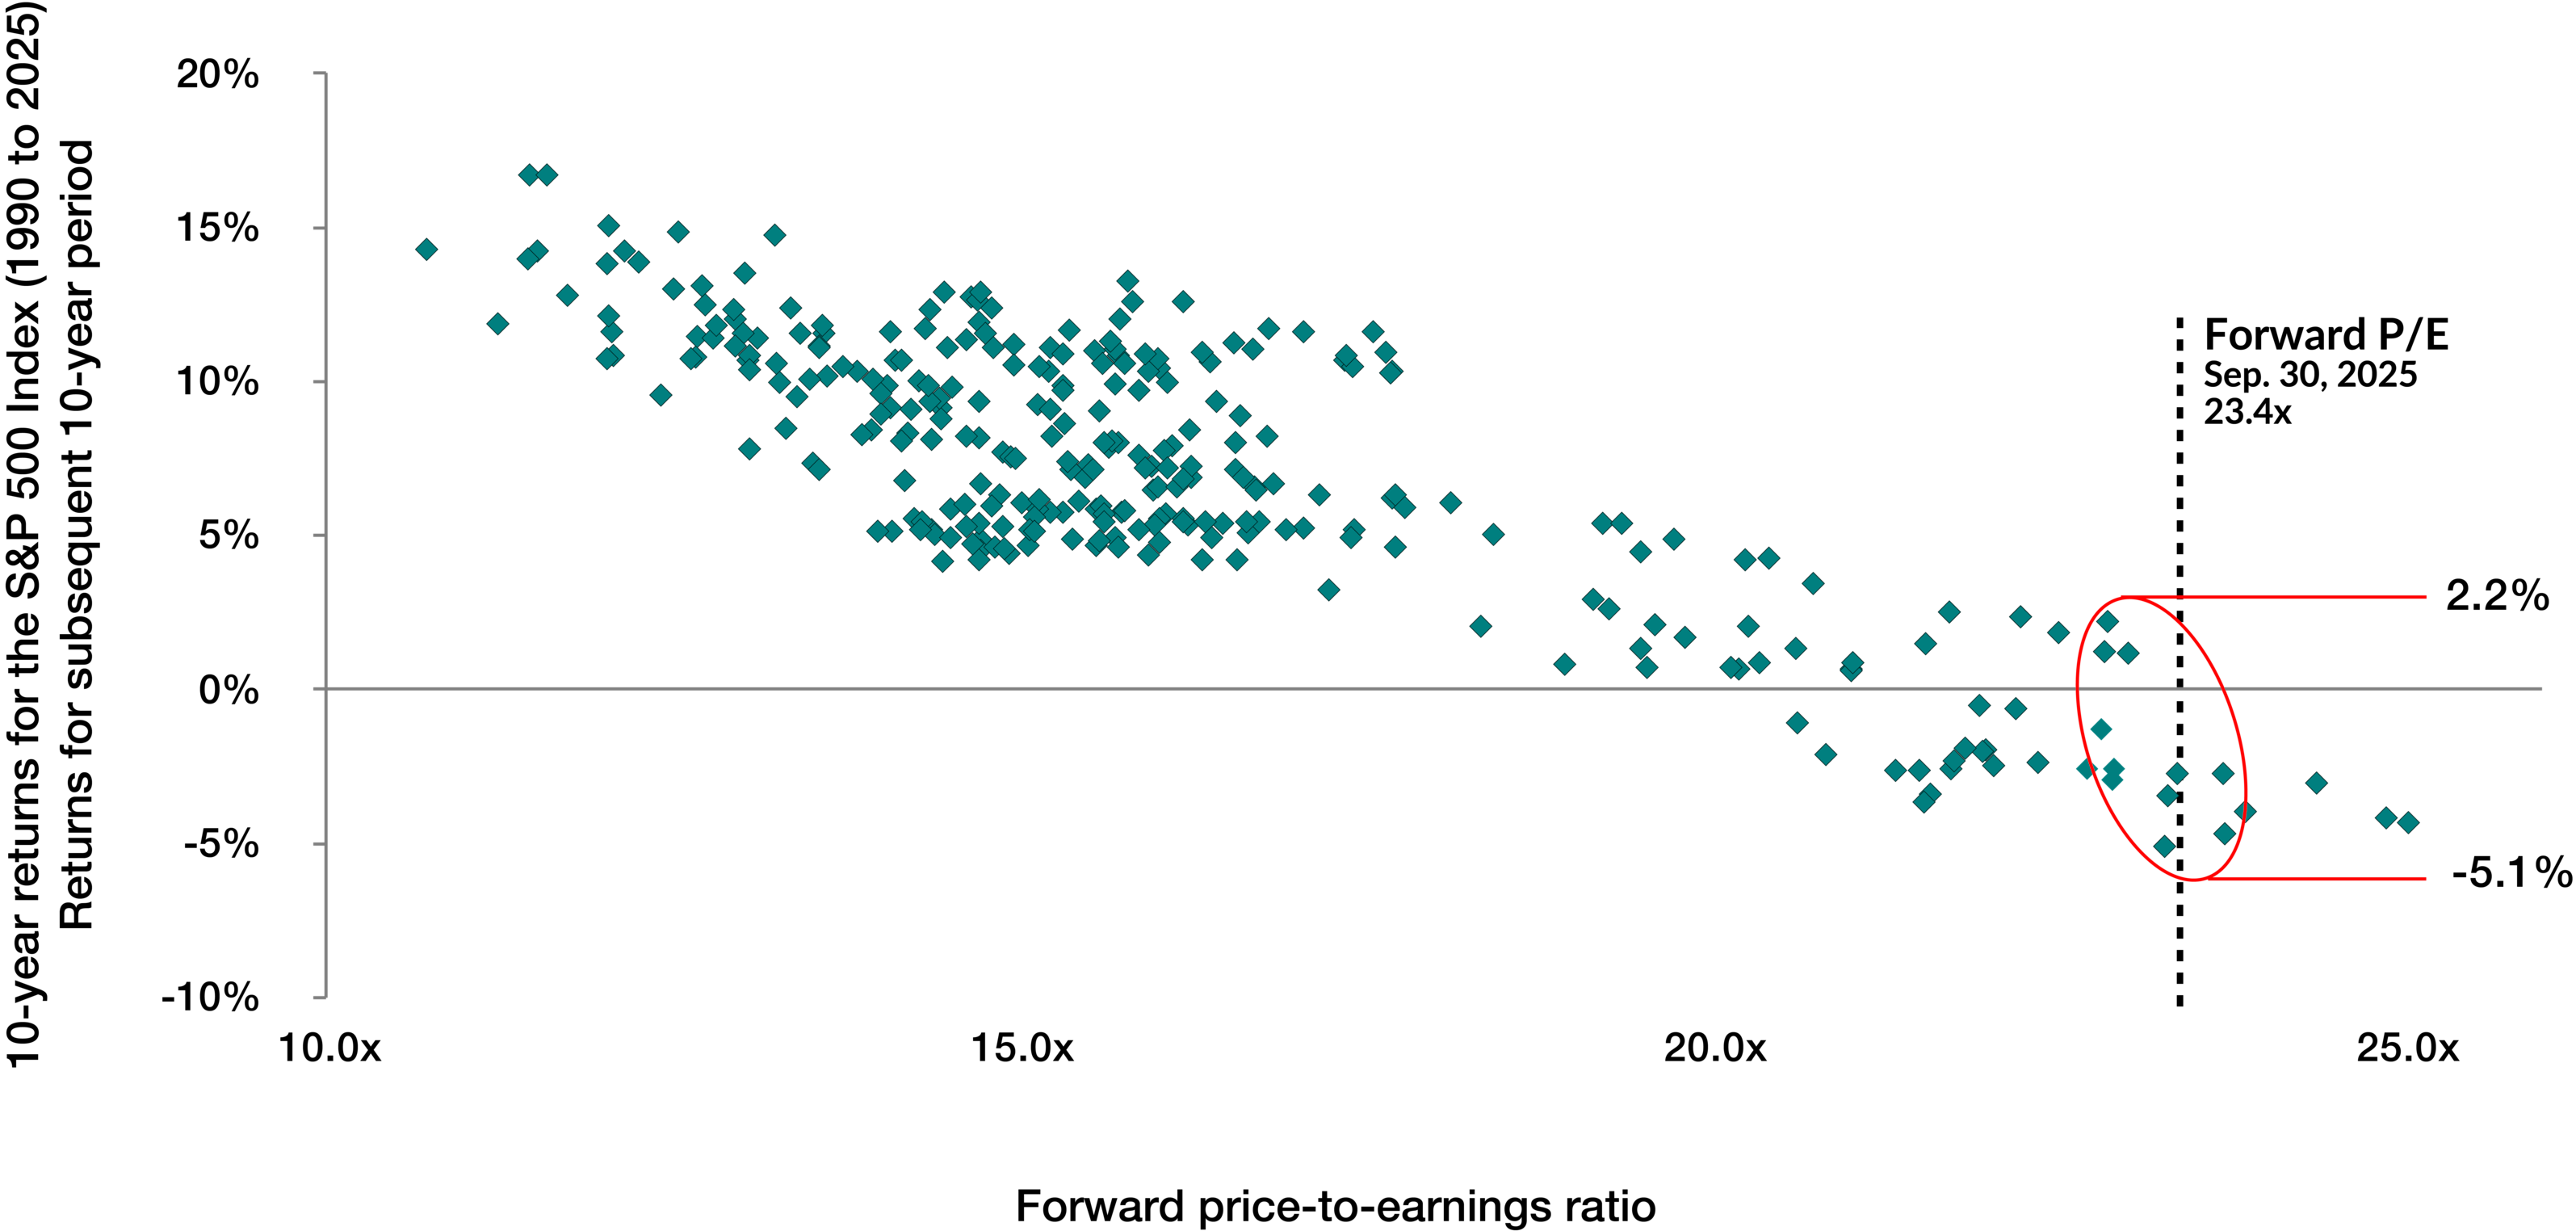
Source: Bloomberg LP. As at September 30, 2025. Total returns in US$. Price-to-earnings (P/E) ratio is a commonly used valuation metric that compares a company’s share price to earnings per share. Forward earnings over the next twelve months were used in price-to-earnings ratio calculations. Historical returns are not indicative of future returns. The S&P 500 Index is a broad-based market-capitalization-weighted index of 500 of the largest and most widely held U.S. stocks. The index is not investible.
Not to complicate the story with math, but 2% and -5% divided by 10 is – well, barely more or even less than zero. Buying the S&P 500 today is like buying a 10-year bond with a yield-to-maturity worse than zero.
We can run the same exercise for high-yield bonds, charting 10-year returns against starting credit spread. What it shows is – a random cloud. Well, not quite. Obviously if you buy high yield when spreads are above 800 basis points (bps), you’re probably going to do very well. Those opportunities are concentrated in years that come about once a decade. But at lower levels, starting credit spreads are almost meaningless in predicting forward 10-year return. The outcome’s been better at 300bps than it’s been at 550bps – totally random.
ICE BofA US High Yield Index – Monthly option-adjusted spreads and subsequent 10-year annualized returns
1996 to 2025
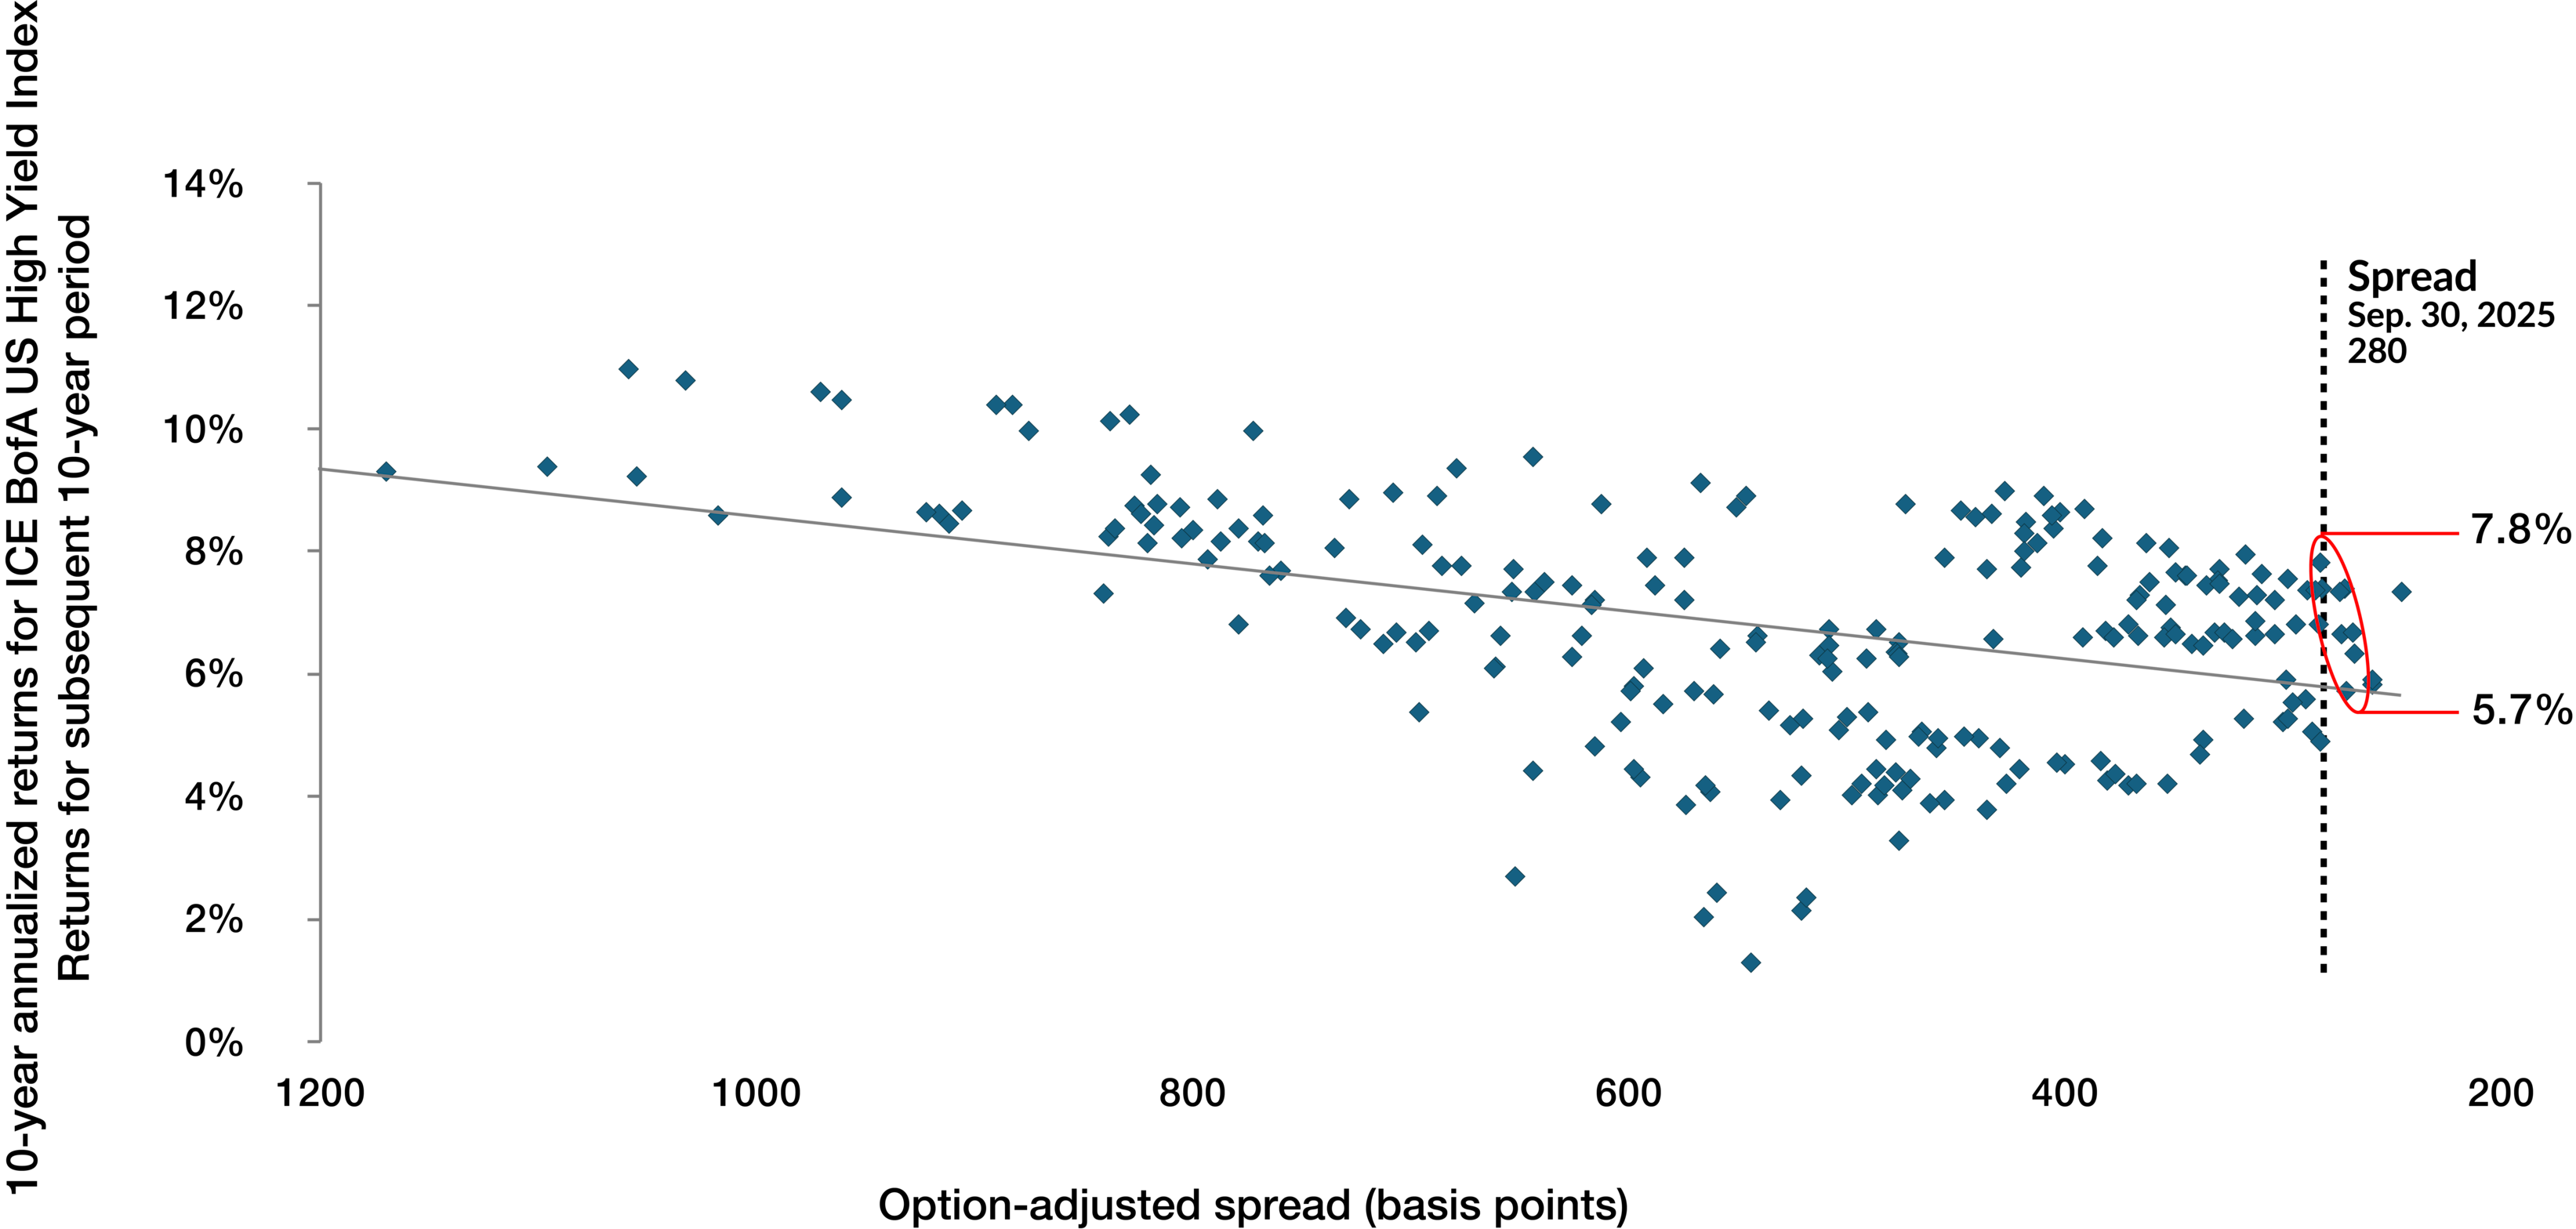
Source, returns: Bloomberg LP. Source, option-adjusted spreads: ICE Data Indices, LLC; Federal Reserve Bank of St. Louis. As at September 30, 2025. Total returns in US$. Historical returns are not indicative of future returns. The option-adjusted spread (OAS) is the difference in spread relative to the risk-free Treasury curve, adjusted for embedded options. OAS helps with comparability of bonds with different structures by removing optionality. The OAS for the ICE BofA US High Yield Index is constructed using each constituent bond’s OAS, weighted by market capitalization. The ICE BofA US High Yield Index tracks the performance of high yield corporate debt denominated in U.S. dollars and publicly issued in the U.S. domestic market. The index is not investible. The period shown is based on available data and intended to provide sufficient historical context. The spreads during the Great Financial Crisis were significantly higher than 1,200 basis points and are not shown in this chart as these were outliers.
And there’s a reason. Bonds are contracts, and those contracts have a maturity, typically three-to-four years for high-yield bonds. At maturity, the money comes back and the proceeds are reinvested at whatever the market has on offer at the time. Over a 10-year period, high-yield bond returns depend a whole lot more on where those proceeds are reinvested than on any commitment made at the beginning.
Entry price matters, but it matters much, much less than entry price with stocks. This is why the fixed-income holdings in your EdgePoint Portfolios crave uncertainty and thrive in volatility. Market dislocations benefit your returns as we look to reinvest into better and better prospects.
At today’s credit spread, historical precedent suggests a 10-year return between 5.7% and 7.8%. That’s a different planet from the zero percent on offer from the S&P 500.
ICE BofA US High Yield Index vs. S&P 500 Index Hypothetical changes in the value of a $10,000 investment over 10 years based on today’s market
As at September 30, 2025
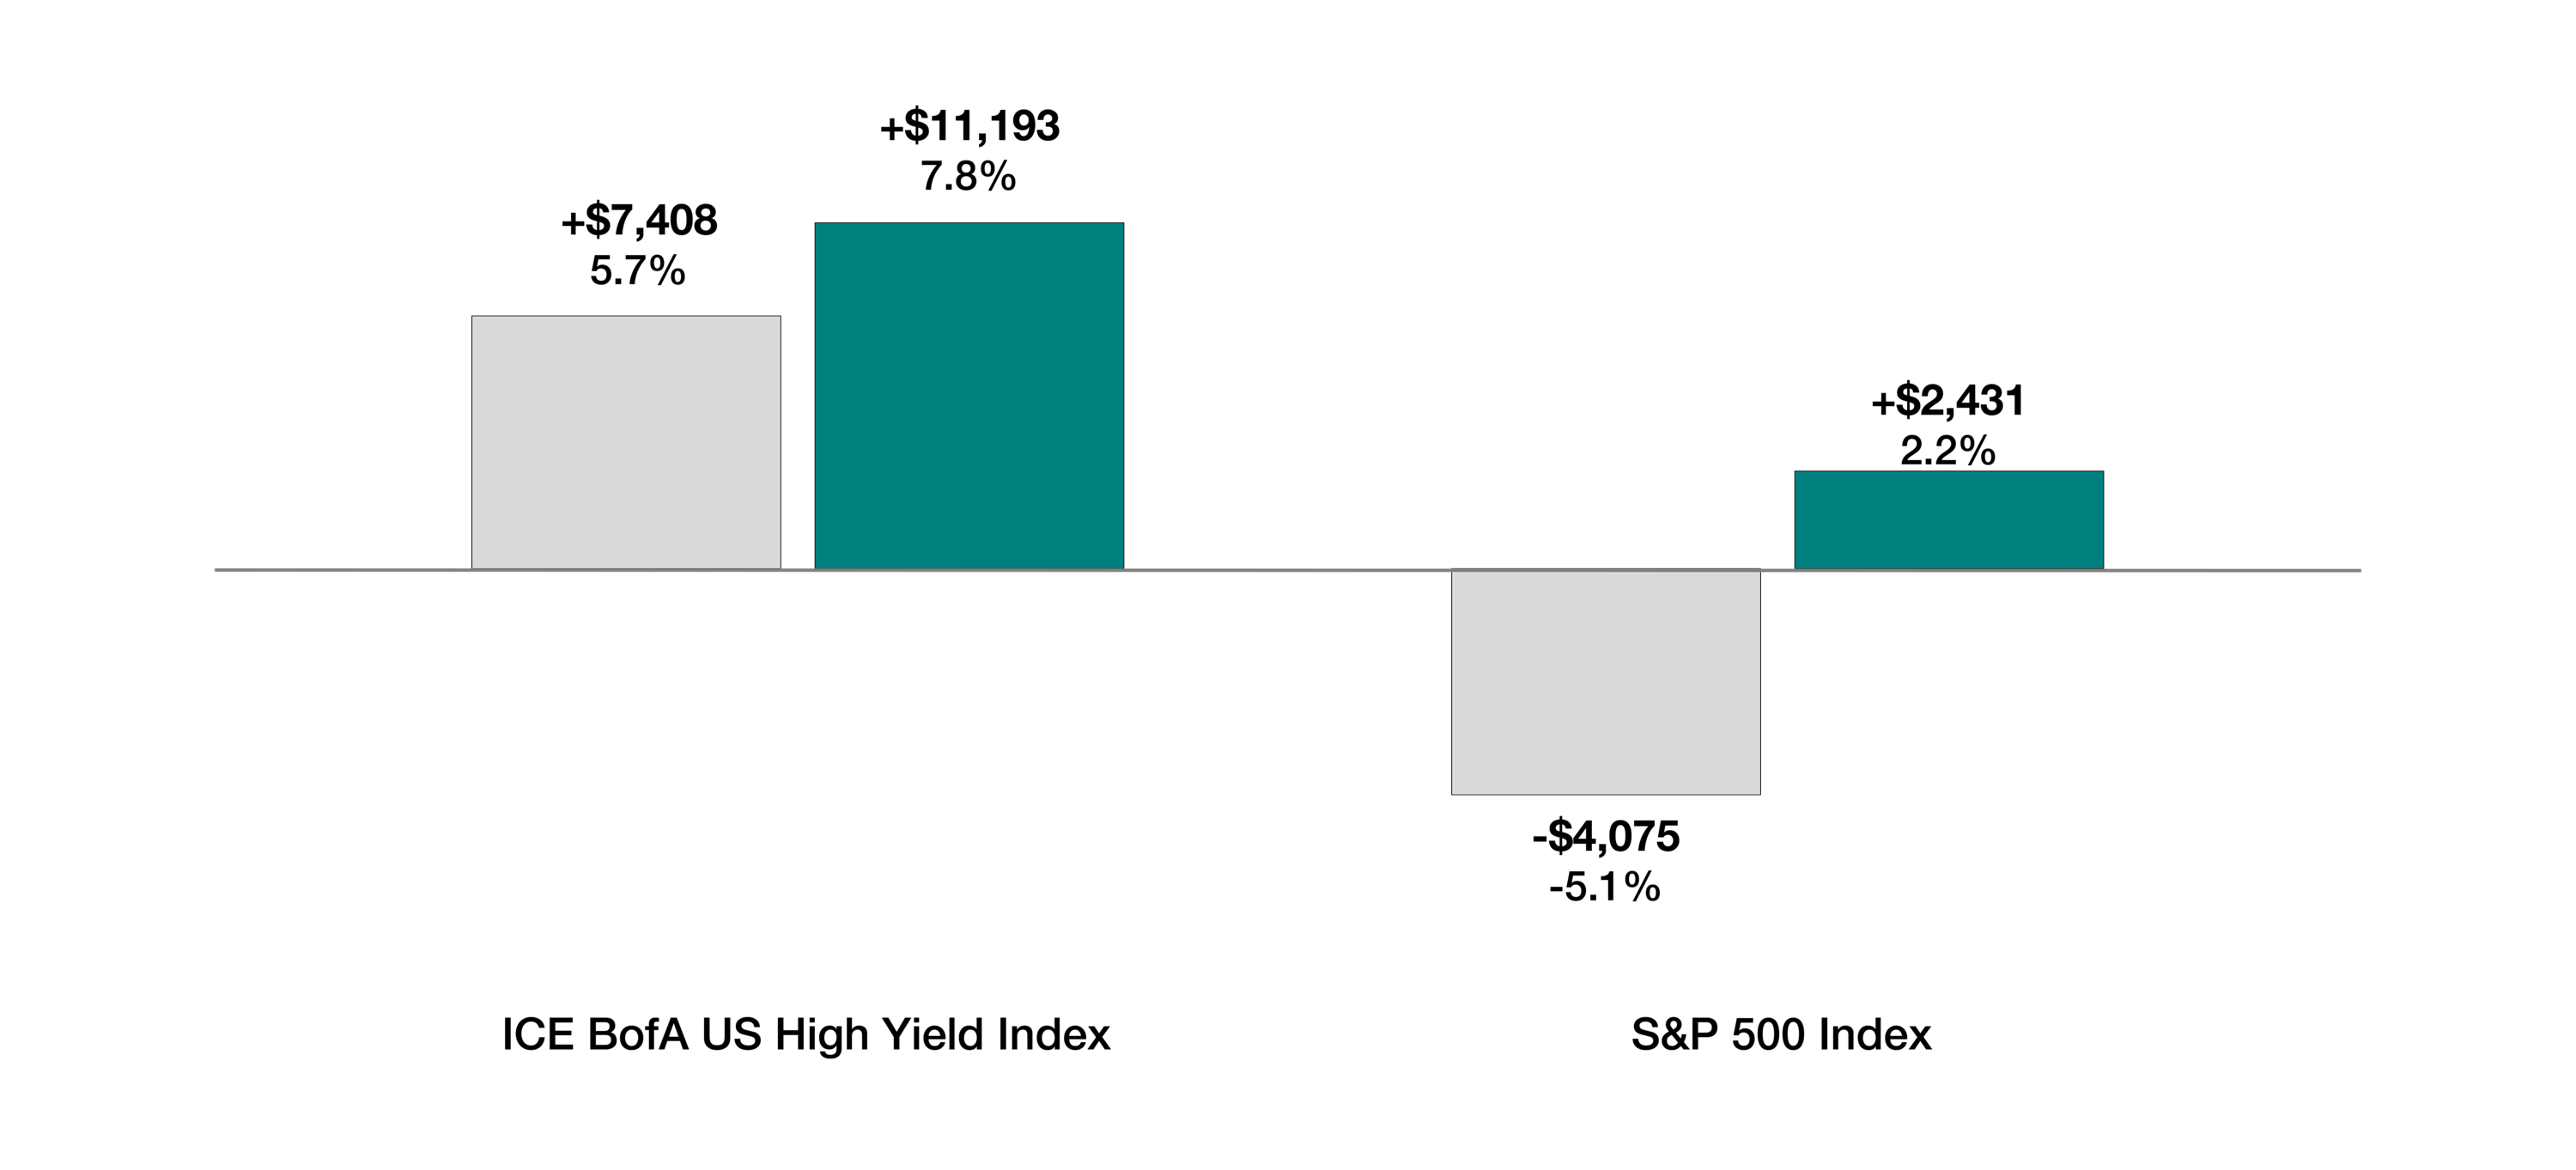
Hypothetical scenarios only shown to compare the highest and lowest historical forward 10-year annualized returns for investments in the ICE BofA US High Yield Index and S&P 500 Index when spreads and P/E ratios were similar to today’s values, respectively.
Source, returns & P/E ratio: Bloomberg LP. Source, option-adjusted spreads: ICE Data Indices, LLC; Federal Reserve Bank of St. Louis. As at September 30, 2025. Total returns in US$. The ICE BofA US High Yield Index tracks the performance of high yield corporate debt denominated in U.S. dollars and publicly issued in the U.S. domestic market. The S&P 500 Index is a broad-based market-capitalization-weighted index of 500 of the largest and most widely held U.S. stocks. The indexes are not investible.
It gets better, because our goal is for the credit holdings in your EdgePoint Portfolios to do much better than the market. This isn’t the first time we’ve had to operate in an environment with tight credit spreads. As in prior periods, we’re looking for mispriced bonds issued by individual businesses that will grow earnings and deliver a return regardless of what the market is doing.
In 2018 when spreads were tight, we made an investment in L Brands Inc., the owner of Bath & Body Works and Victoria’s Secret.vi The company was struggling as one-third of stores were in money-losing malls. Similarly, in early 2022, we bought the bonds of a company called Carpenter Technology Corp., a manufacturer of superalloys sold into the aerospace end market.vii The company was bleeding cash as Airbus and Boeing slammed the brakes on aircraft production during the pandemic.
Since making the investments, L Brands shuttered money-losing stores and split its business into two publicly traded companies – both could easily afford what the combined company had had in total debt. And as aircraft production has resumed, Carpenter made more money last year than it has in total debt. Both L Brands and Carpenter are within a single notch of an investment grade rating and have generated internal rates of return of 12.1% and 10.6%, respectively.1 When we’re paid back, we’ll redeploy into the best opportunity.
This year, we have invested in two new companies in the “building products” industry, which is a fancy way of saying “parts of a house” (think bathtubs and doors). Like so many others, typical cyclicality for these businesses was sent for a tailspin during COVID. New home construction and repairs and renovations usually have two opposing cycles – people either buy a new home or fix their old home, not both. With the bizarre pandemic-era boom and bust, both pieces have recently cycled together.
In our view, the chronic housing shortage across all of North America means construction activity will have to come back sooner rather than later. Builders will solve for current affordability even if it means building smaller homes than what’s been typical for the past decade. If we’re right and construction returns, both bonds will be very strong performers. If we’re wrong, you’ll need a new bathtub eventually.
Alternate ending
We all know that bad stock markets exist. It’s not always this easy. But we also know that we need to make money through periods where equities do poorly. This has driven the demand for “Alternatives” – for hedge funds and private assets and all these products ripe with shenanigans ginned up as removing risk, but in many cases just creating more crevices to hide it.
1 As at September 30, 2025. Total annualized return in C$. Internal rate of return (IRR) is money-weighted return that accounts for the timing and magnitude of cash flows into an investment and represents an investment’s actual return. The IRRs shown are for the security’s holding period in EdgePoint Global Growth & Income Portfolio.
Annualized total returns, net of fees (excluding advisory fees), in C$. As at September 30, 2025
EdgePoint Global Growth & Income Portfolio, Series F – Since inception (Nov. 17, 2008): 11.35%, 15-year: 10.40%, 10-year: 8.30%, 5-year: 10.49%, 3-year: 13.64%, 1-year: 10.95%, YTD: 9.99%.
Series F is available to investors in a fee-based/advisory fee arrangement and doesn’t require EdgePoint to incur distribution costs in the form of trailing commissions to dealers.
Investors don’t need any of them. We believe that a simple portfolio of corporate bonds – particularly high-yield corporate bonds – carefully studied and prudently selected, is the ideal solution to navigate the next equity bear market. It’s an asset class that thrives in uncertainty and capitalizes on volatility. The price might move, but that’s how you know it’s real. When equities feel frothy, it’s the only valid alternative.